
Data you can read without explanation
One dashboard for the entire area: consumption, peaks, feedback, and deviations, per day or per location.
A dashboard is not a report
A report tells you what has happened. A dashboard shows you what is happening now, at the level where you can make a change.
Figures that no one opens
A monthly report in the mail is read by no one who can act on it that same week.
Graphs without a question attached
Data you don't know what question it answers, is work instead of insight.
Three systems, three truths
Electricity here, water there, temperature in a third package. No one ultimately lays them side by side.
One screen for the entire site
All meters come together in the same dashboard: electricity, gas, water, heating, temperature, and air quality. No four portals, no export to a spreadsheet.
You can compare measurement points and periods side by side. This field against that field, this week against the same week last year, this chalet against the chalet next door.
This makes a deviation something that stands out, rather than something you have to search for.
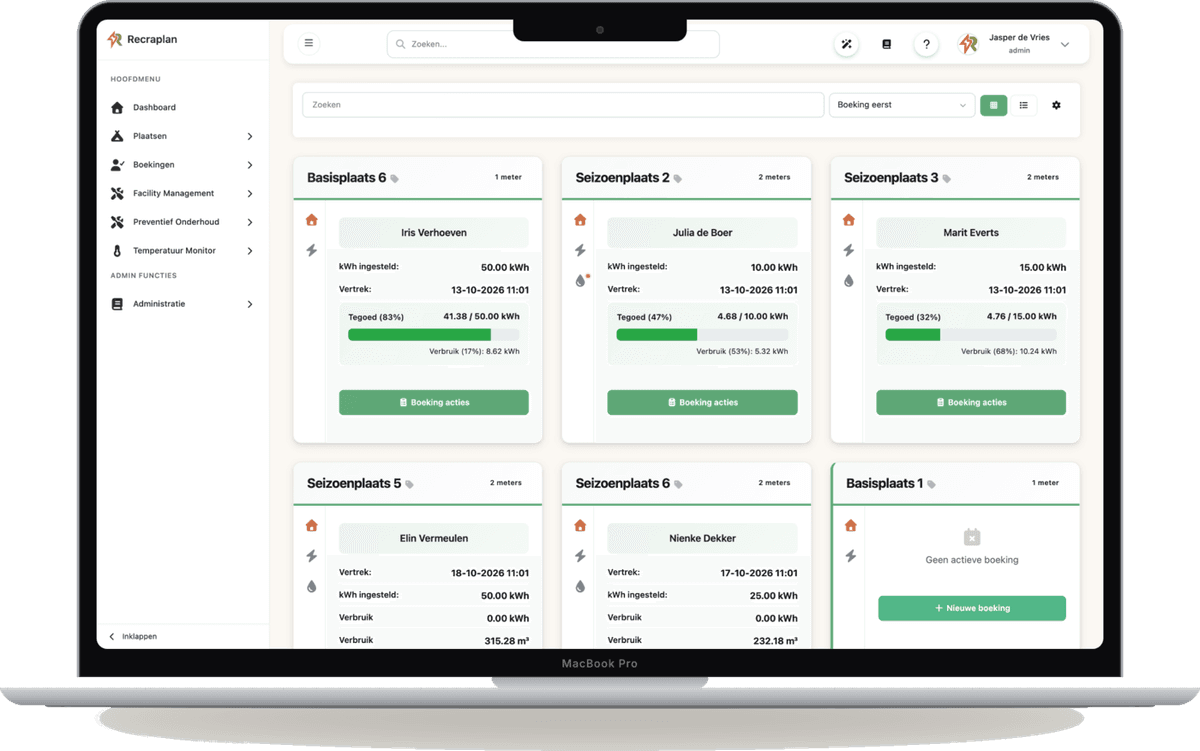
Four questions that the dashboard answers
Not more figures, but the figures that accompany a decision.
Where is it going?
By building, by group, by location. Down to the level where you can make a change.
When does the peak occur?
Reviewable by the hour, because your capacity rate is linked to a quarter-hour and not a month.
What is not normal here?
Limits per installation, with a notification as soon as something exceeds.
What should be on the invoice?
Consumption per location or accommodation, ready to be passed on.
How a number becomes an action
Insight is not an endpoint. It is the link between what the meter sees and what you do.
* The last step can be automated or done manually. What you choose depends on how often it occurs.
The dashboard is so user-friendly that I can easily manage everything without technical knowledge.
Camping Reina's Farmyard
Looking ahead at your own figures
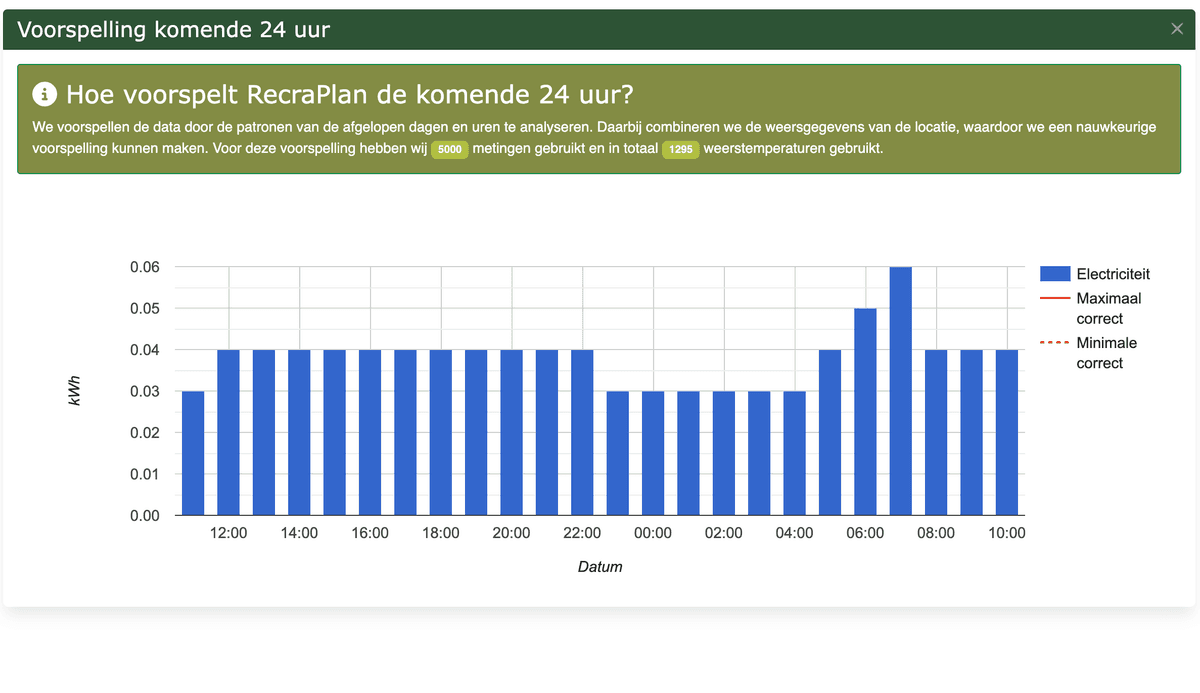
In addition to what has happened, the dashboard shows what is likely to come: consumption in the next 24 hours, based on your own history.
This helps with planning. You know if tomorrow's peak fits within your connection and whether it makes sense to move something to another hour.
Right down to the campsite
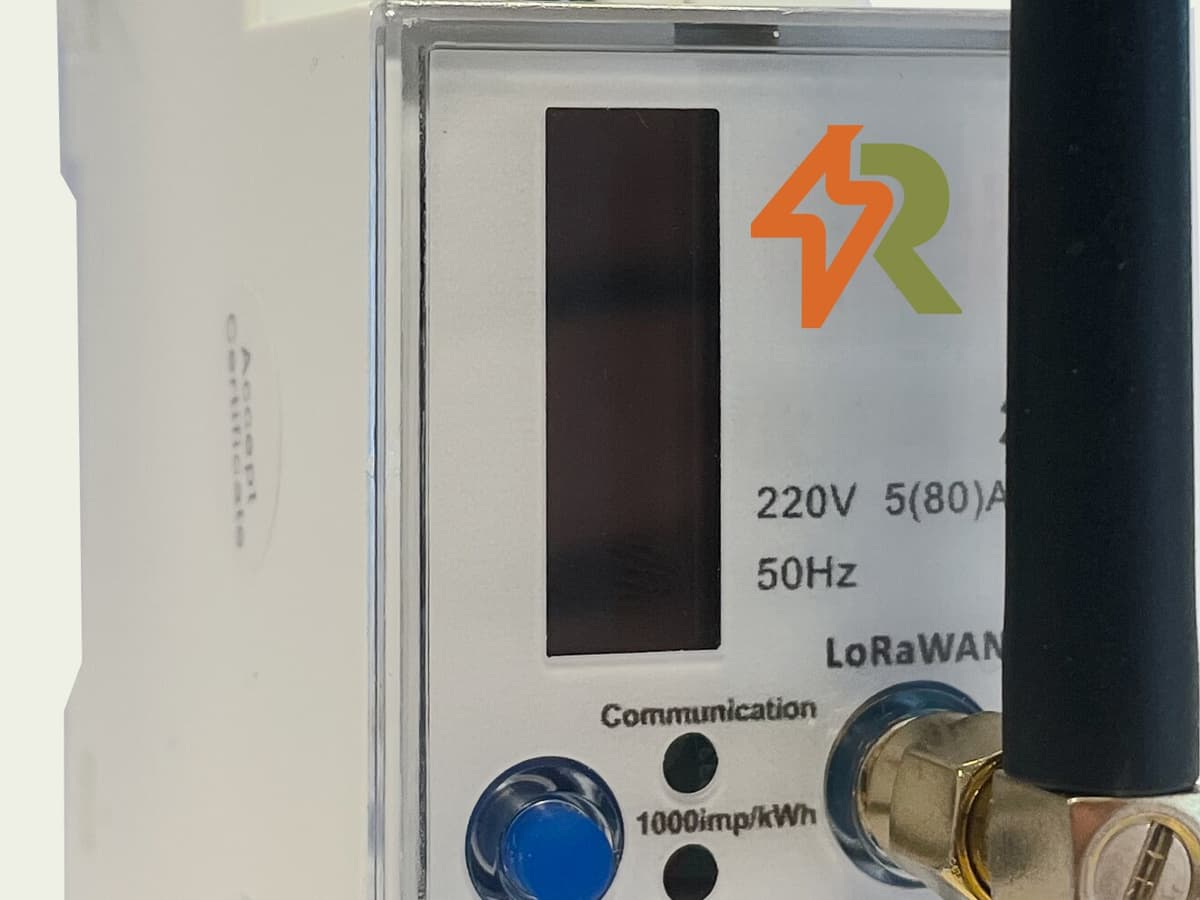
The kWh meters click into the DIN rail of your existing distribution box. No digging is required, and the box remains in place.
In the dashboard, you can see the current consumption per location and the trend over time, and set the rate that the guest pays.
At metered locations, we see an average of twenty percent less consumption, as a guest who sees their own meter behaves differently.
View the dashboard with your own data
Half an hour, online or on your location. Then you'll know if it reads as you hope.